Entry 1, Credit --- Andy Liu (2021 Spring)
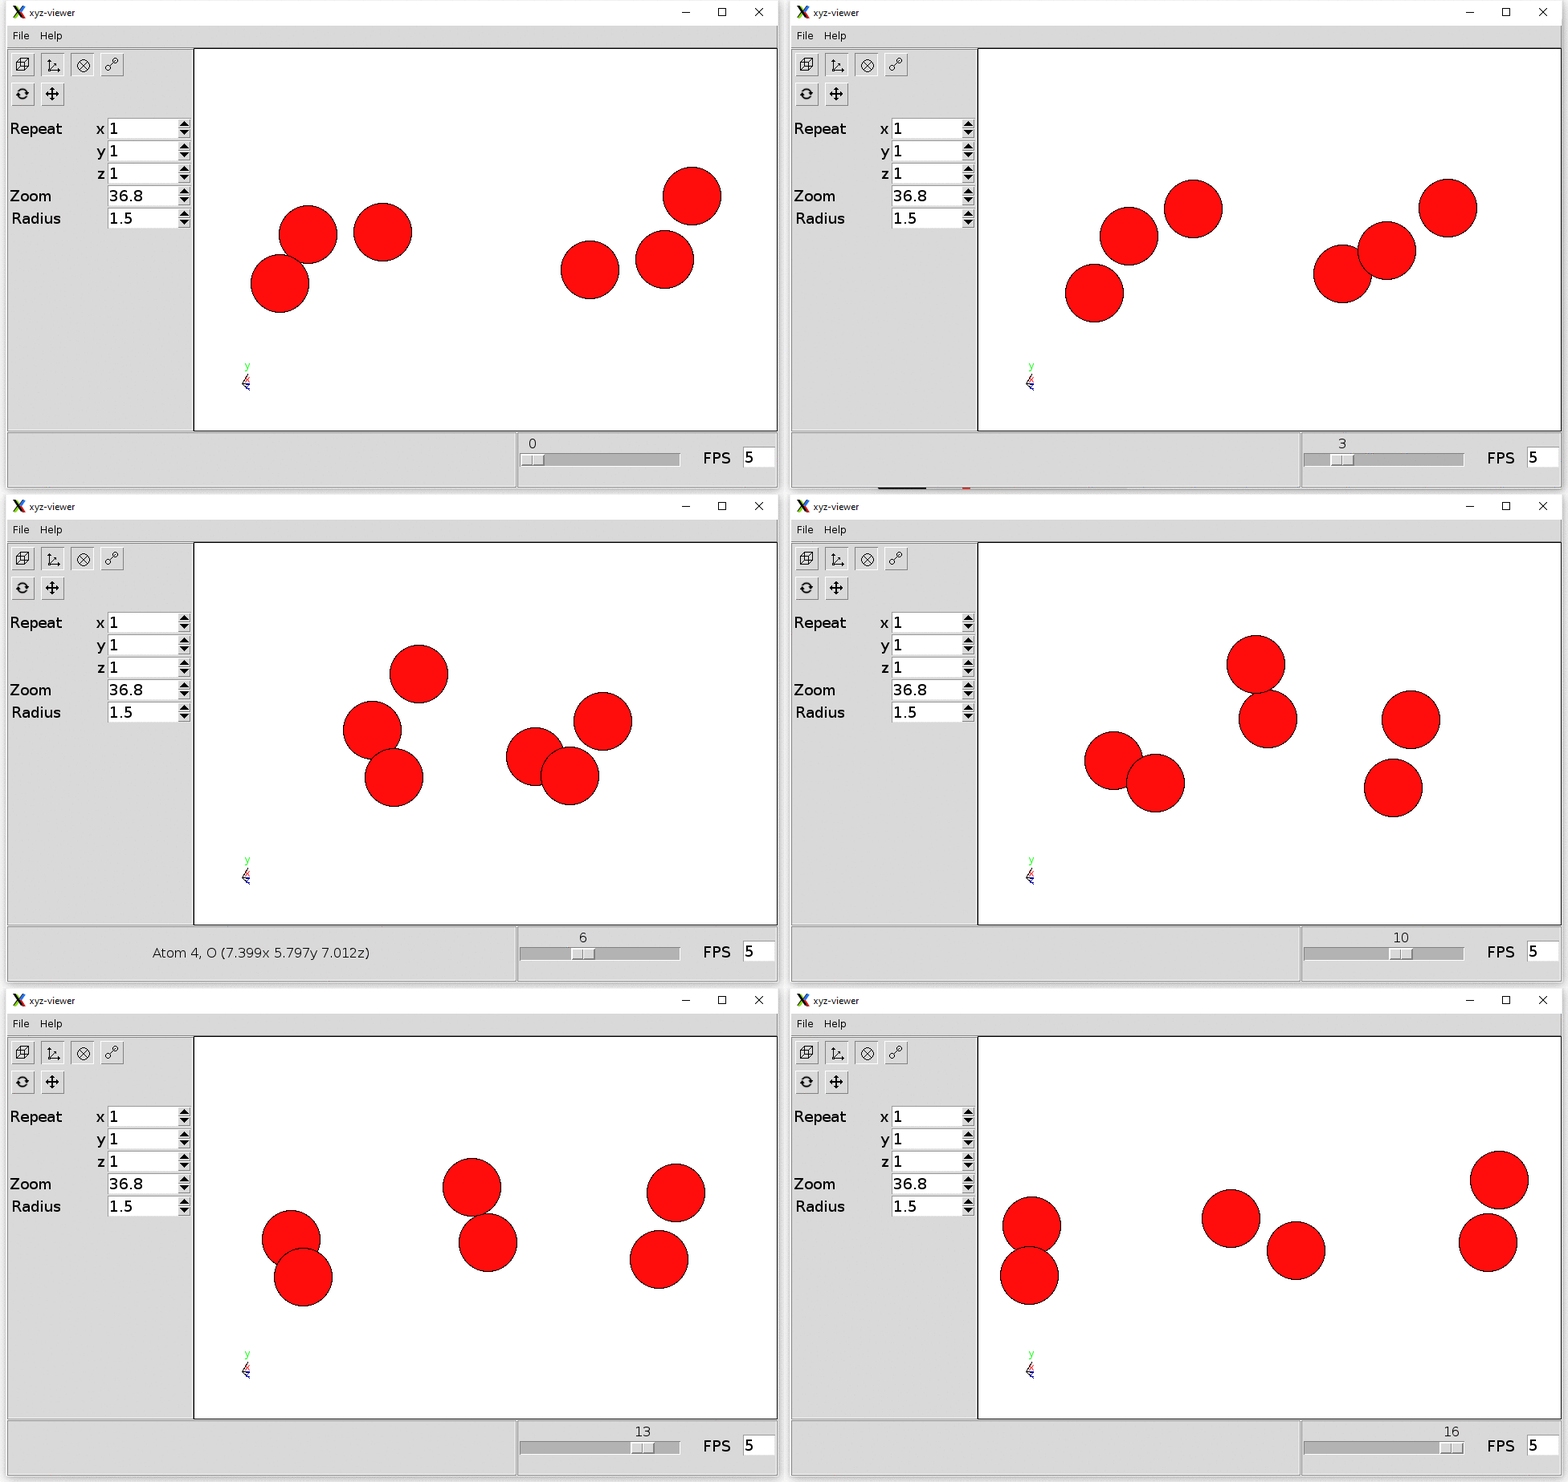
Reaction: 2 O3 → 3 O2


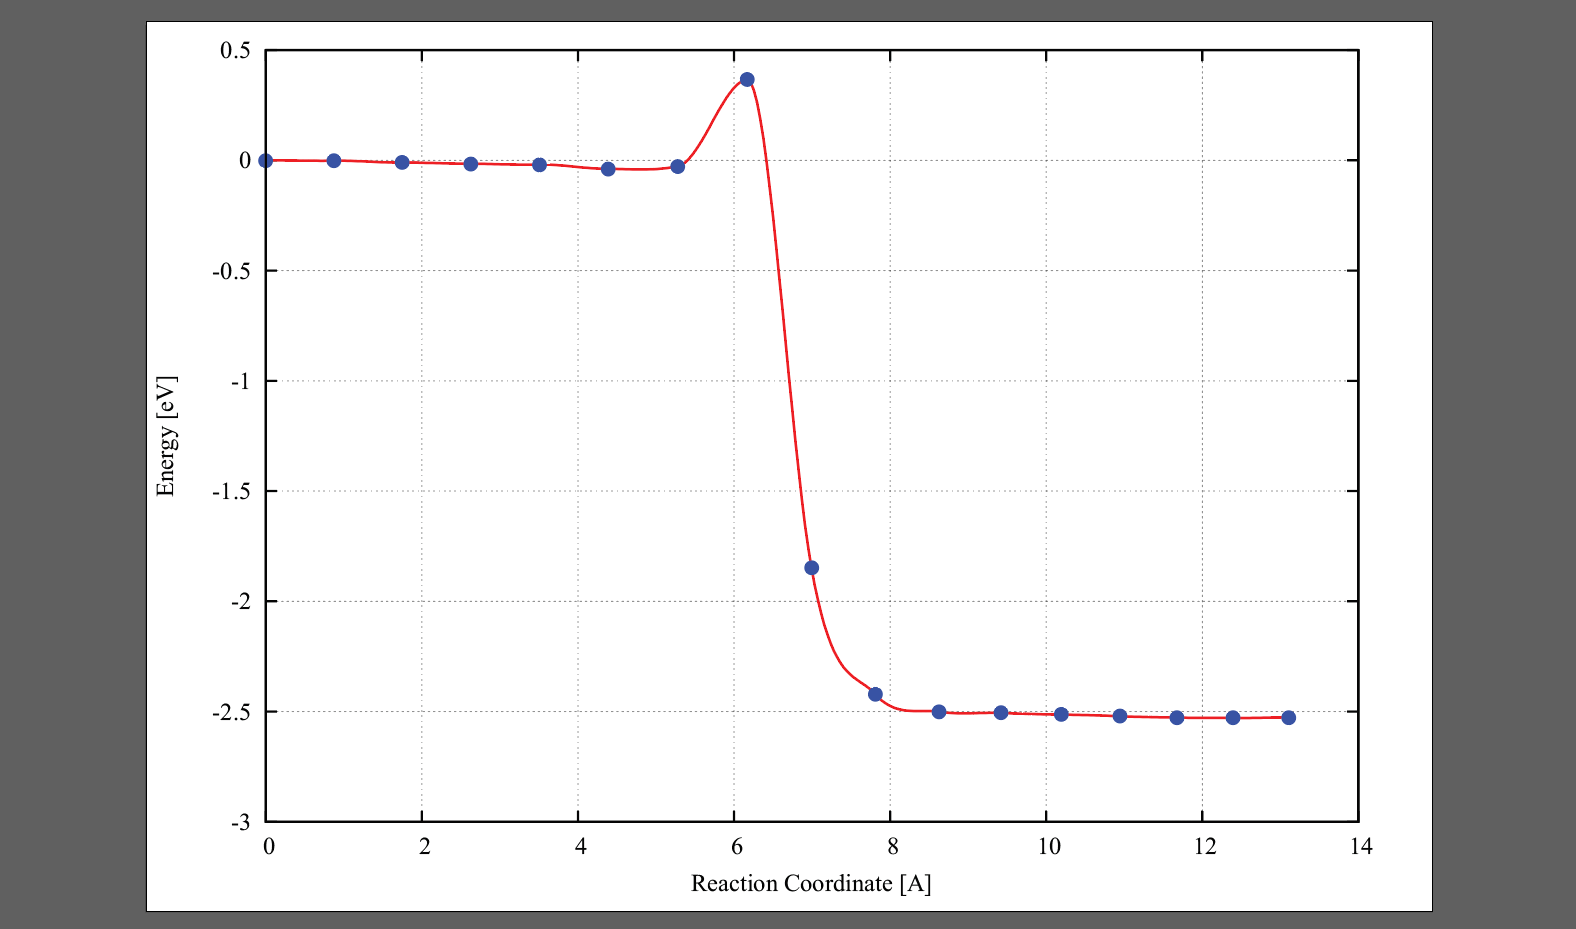
The forces on each image are below:
0 0.008629 -27.049200 0.000000
1 0.013342 -27.051000 -0.001800
2 0.013200 -27.059600 -0.010400
3 0.018512 -27.064800 -0.015600
4 0.032164 -27.068800 -0.019600
5 0.024401 -27.088100 -0.038900
6 0.015714 -27.076300 -0.027100
7 0.015602 -26.683300 0.365900
8 0.023034 -28.897900 -1.848700
9 0.092396 -29.471500 -2.422300
10 0.086828 -29.550000 -2.500800
11 0.093020 -29.555400 -2.506200
12 0.115018 -29.563000 -2.513800
13 0.060166 -29.570300 -2.521100
14 0.038389 -29.576400 -2.527200
15 0.026022 -29.578300 -2.529100
16 0.007002 -29.575400 -2.526200
Comment: Even though not every image has a force below 0.01, this band is useful and can be seen as converged because the image with the largest force (0.11) is far from the saddle and is almost the same energy as the final state. Images around the saddle point has reasonable residue forces around 0.02 to 0.03. Most importantly, the climbing image has an energy that hasn't changed greatly while its force has been reducing consistently:
Image Force Energy Energy relative to 00
7 0.678222 -23.304200 3.745000
7 0.522333 -24.055100 2.994100
7 0.390910 -25.101800 1.947400
7 0.222170 -25.645600 1.403600
7 0.054919 -26.589000 0.460200
7 0.057665 -26.444200 0.605000
7 0.105297 -26.498000 0.551200
7 0.463610 -26.674700 0.374500
7 0.050158 -26.682800 0.366400
7 0.015602 -26.683300 0.365900

